

Used car insights
What we actually find when we inspect used cars — the faults, the cover-ups, and what really lasts. Drawn from real pre-purchase inspections, not brochures or forum lore.
| Cars inspected | 5,569 |
| Issues discovered | 30,631 |
| Body damage found | 33,273 |
| Pictures taken | 239,631 |
| Last update | Oct 2, 2026 |
Every car we inspect receives a thorough examination and an overall score from 0 to 100. A perfect score of 100 indicates a vehicle in like-new condition with no technical or cosmetic issues. Points are deducted for each issue in proportion to the complexity and cost of the repair. This scoring system, paired with real data on what commonly goes wrong, gives you a clear and honest overview of the used car market and what to watch for when buying your next vehicle.
Most common faults
Share of inspected cars where each item was flagged.
How they score
Filter by the age, price or mileage of the car you're considering — the faults and scores update as you drag. One filter at a time.
All ages · 5,569 cars All prices All mileagesPopular budgets: $5k · $10k · $15k · $20k · $30k · $40k
Prefer the full tool? Check a car — with price analysis and common failures →
How far each brand typically holds up — the mileage where the average one's inspection score dips below decent (55/100), by body type, from every vehicle we've inspected (rolled-back odometers excluded). The bars share one scale, so you can see how much longer trucks and SUVs tend to run than cars.
A striped bar means we don't have enough of that body type for the brand yet, so we show its overall figure — it sharpens into a body-type number as we inspect more.
Is each brand getting more reliable over the years, or less? We compare its newer models against its older ones — always at the same age, 5–10 years old, so the comparison is fair. Some are clearly improving; others are coasting on a reputation they earned long ago. The three biggest movers:
See every brand's trajectory → · Or put two brands head to head →
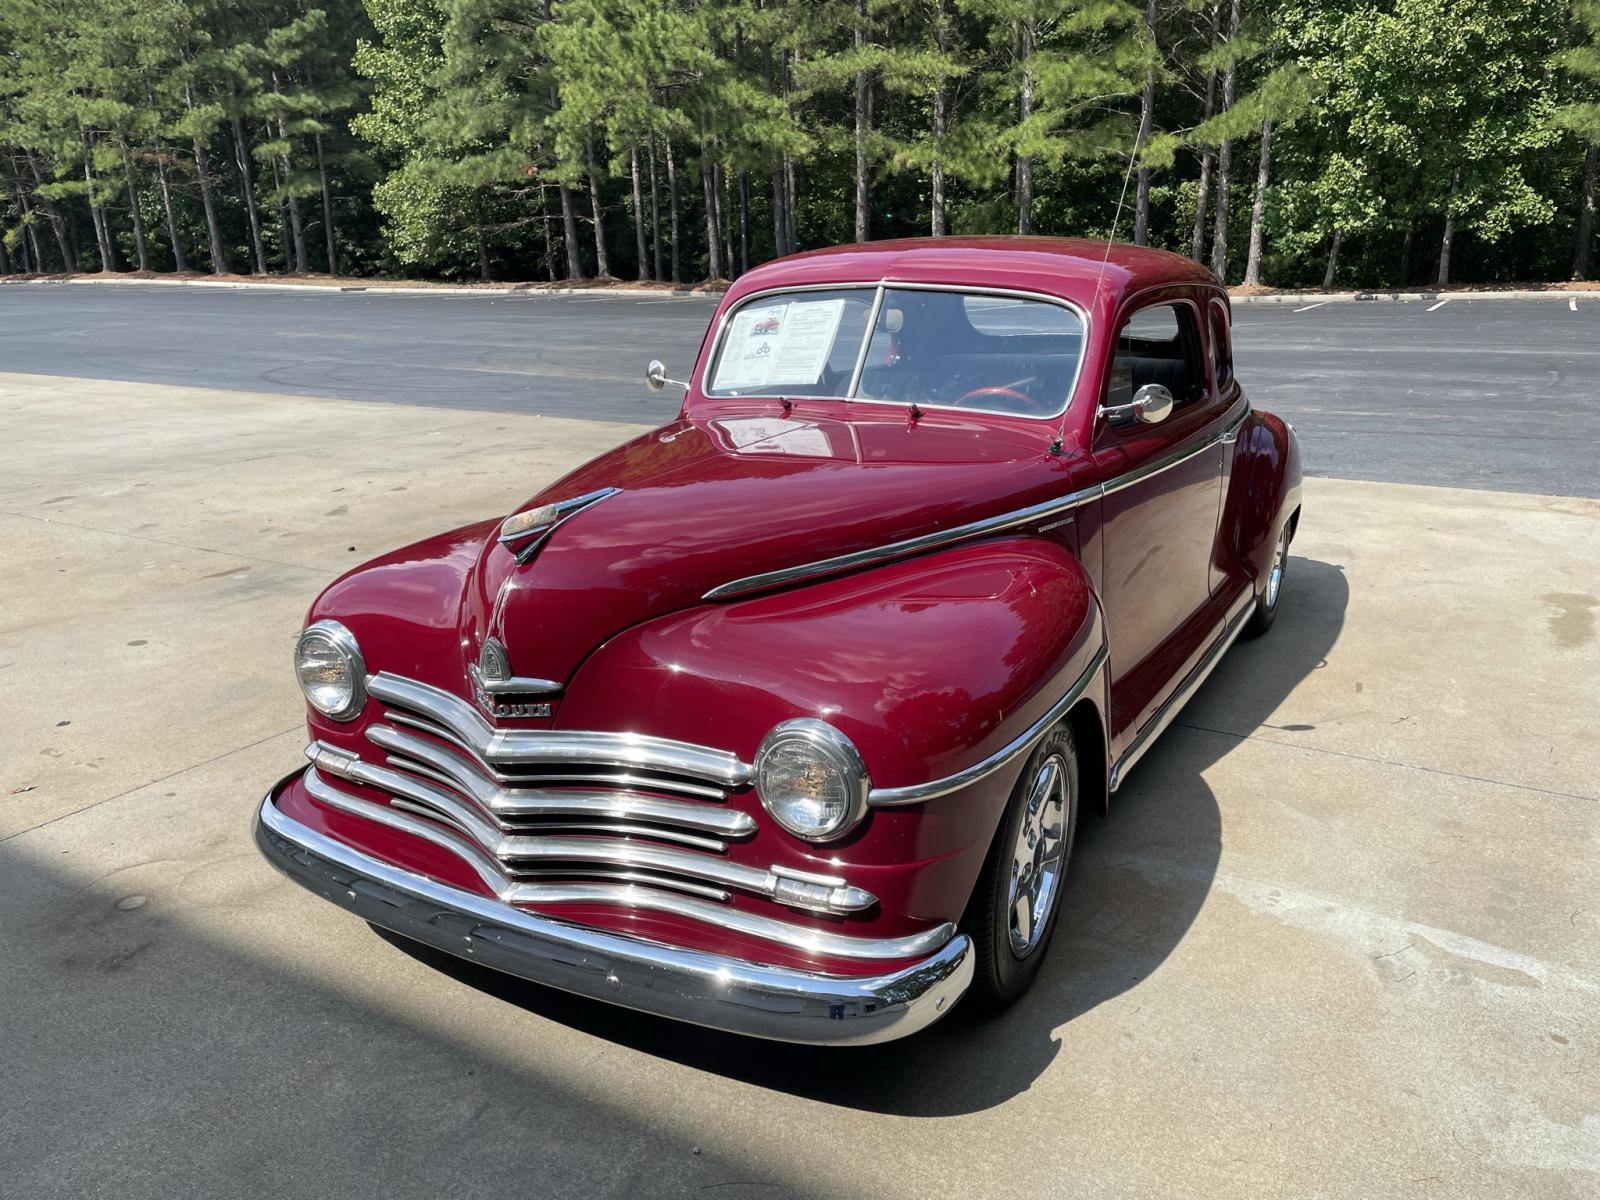
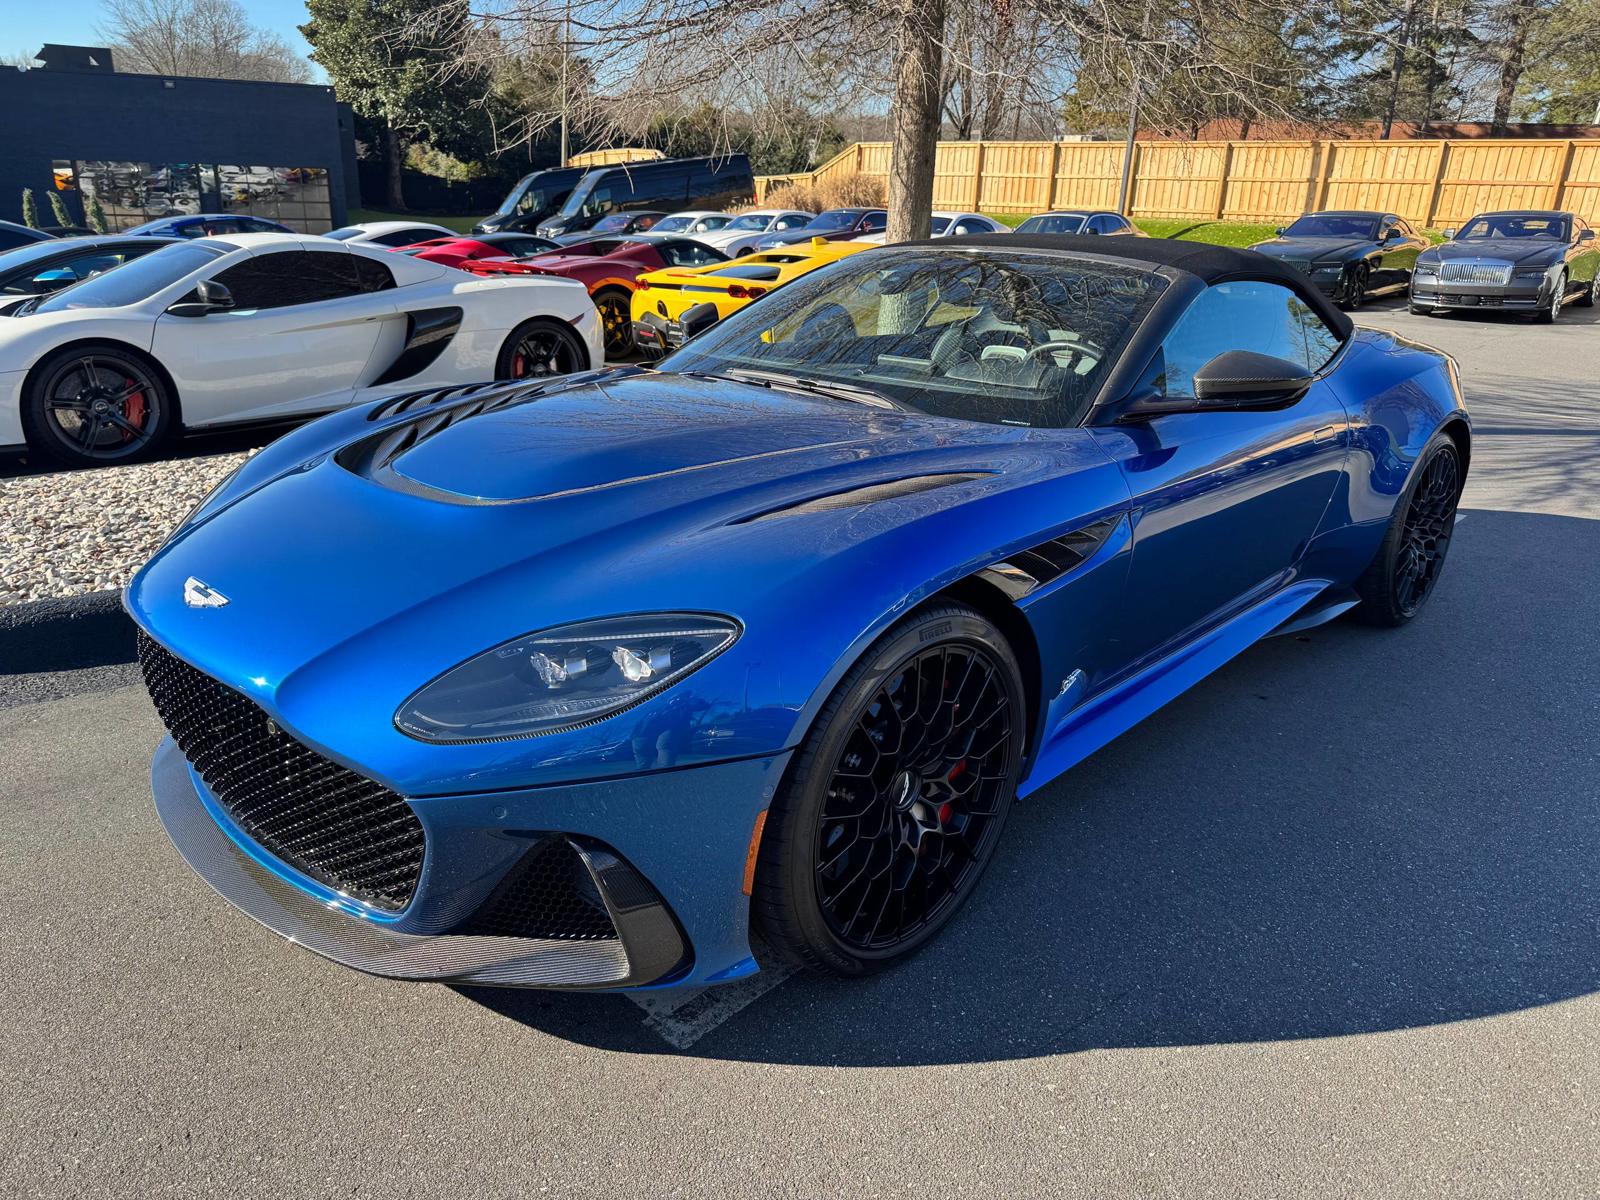
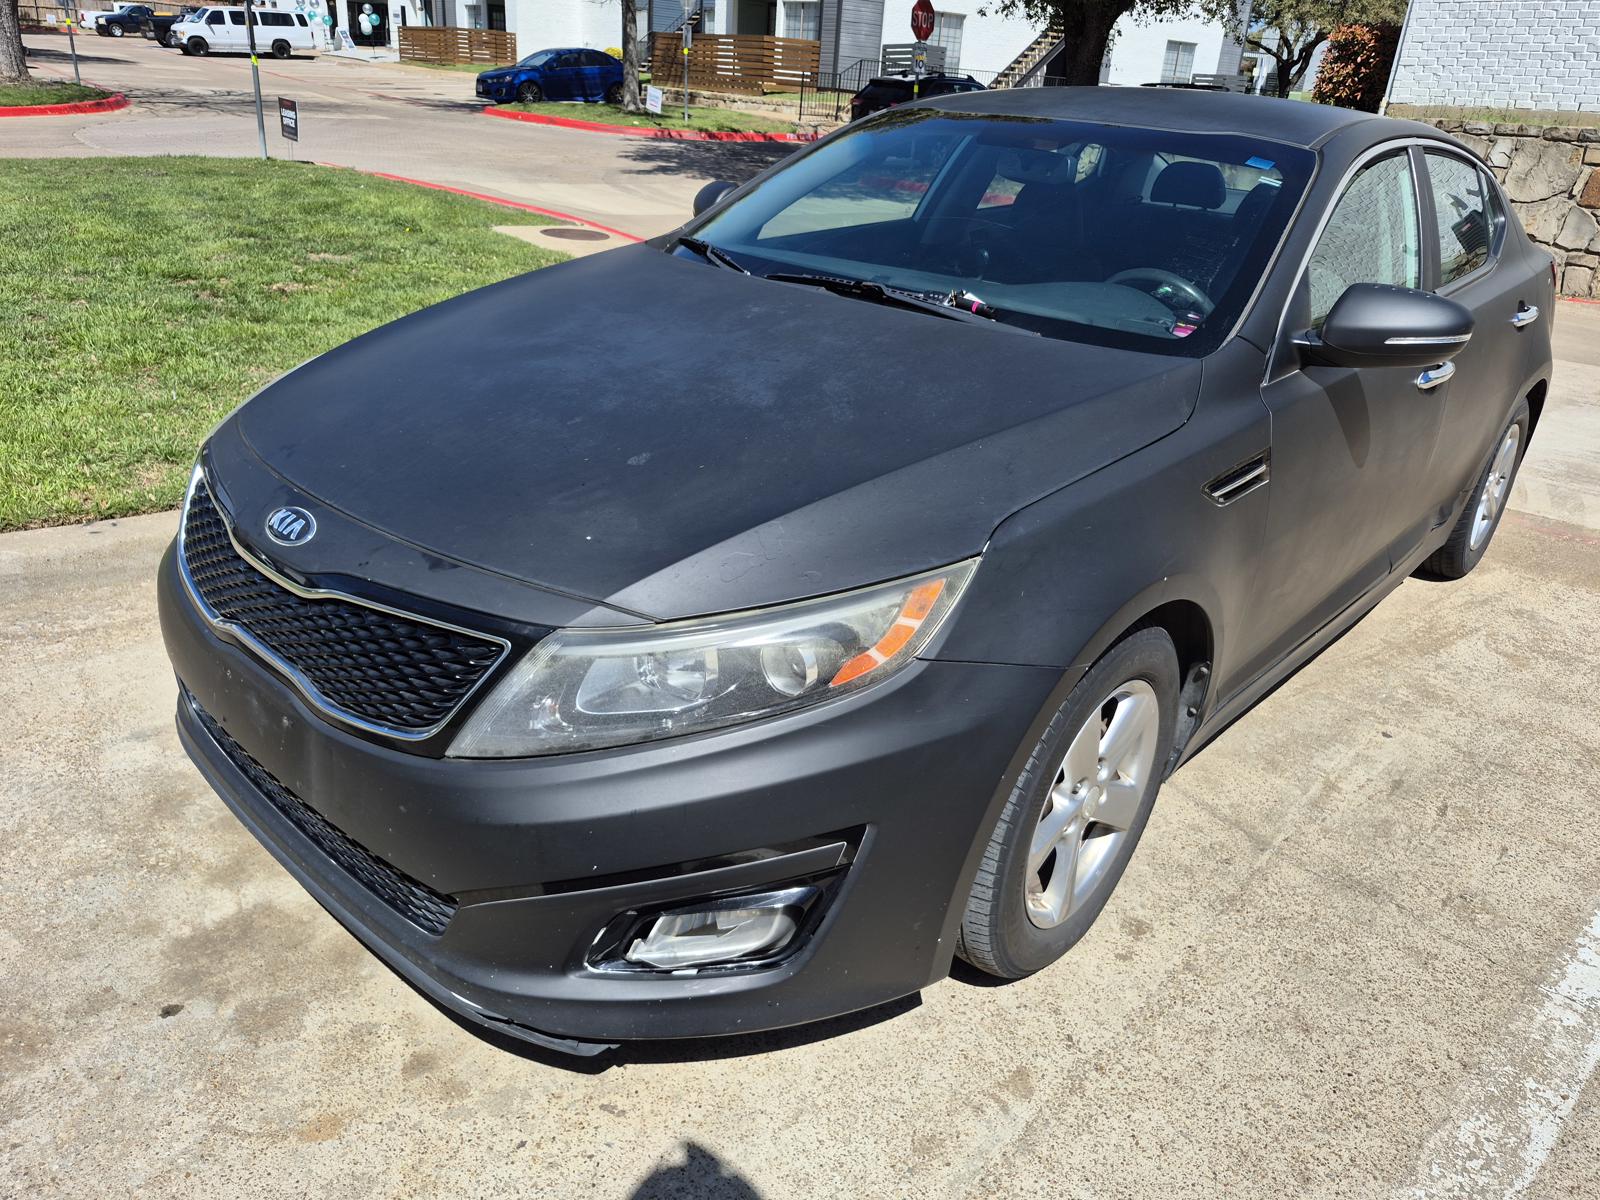
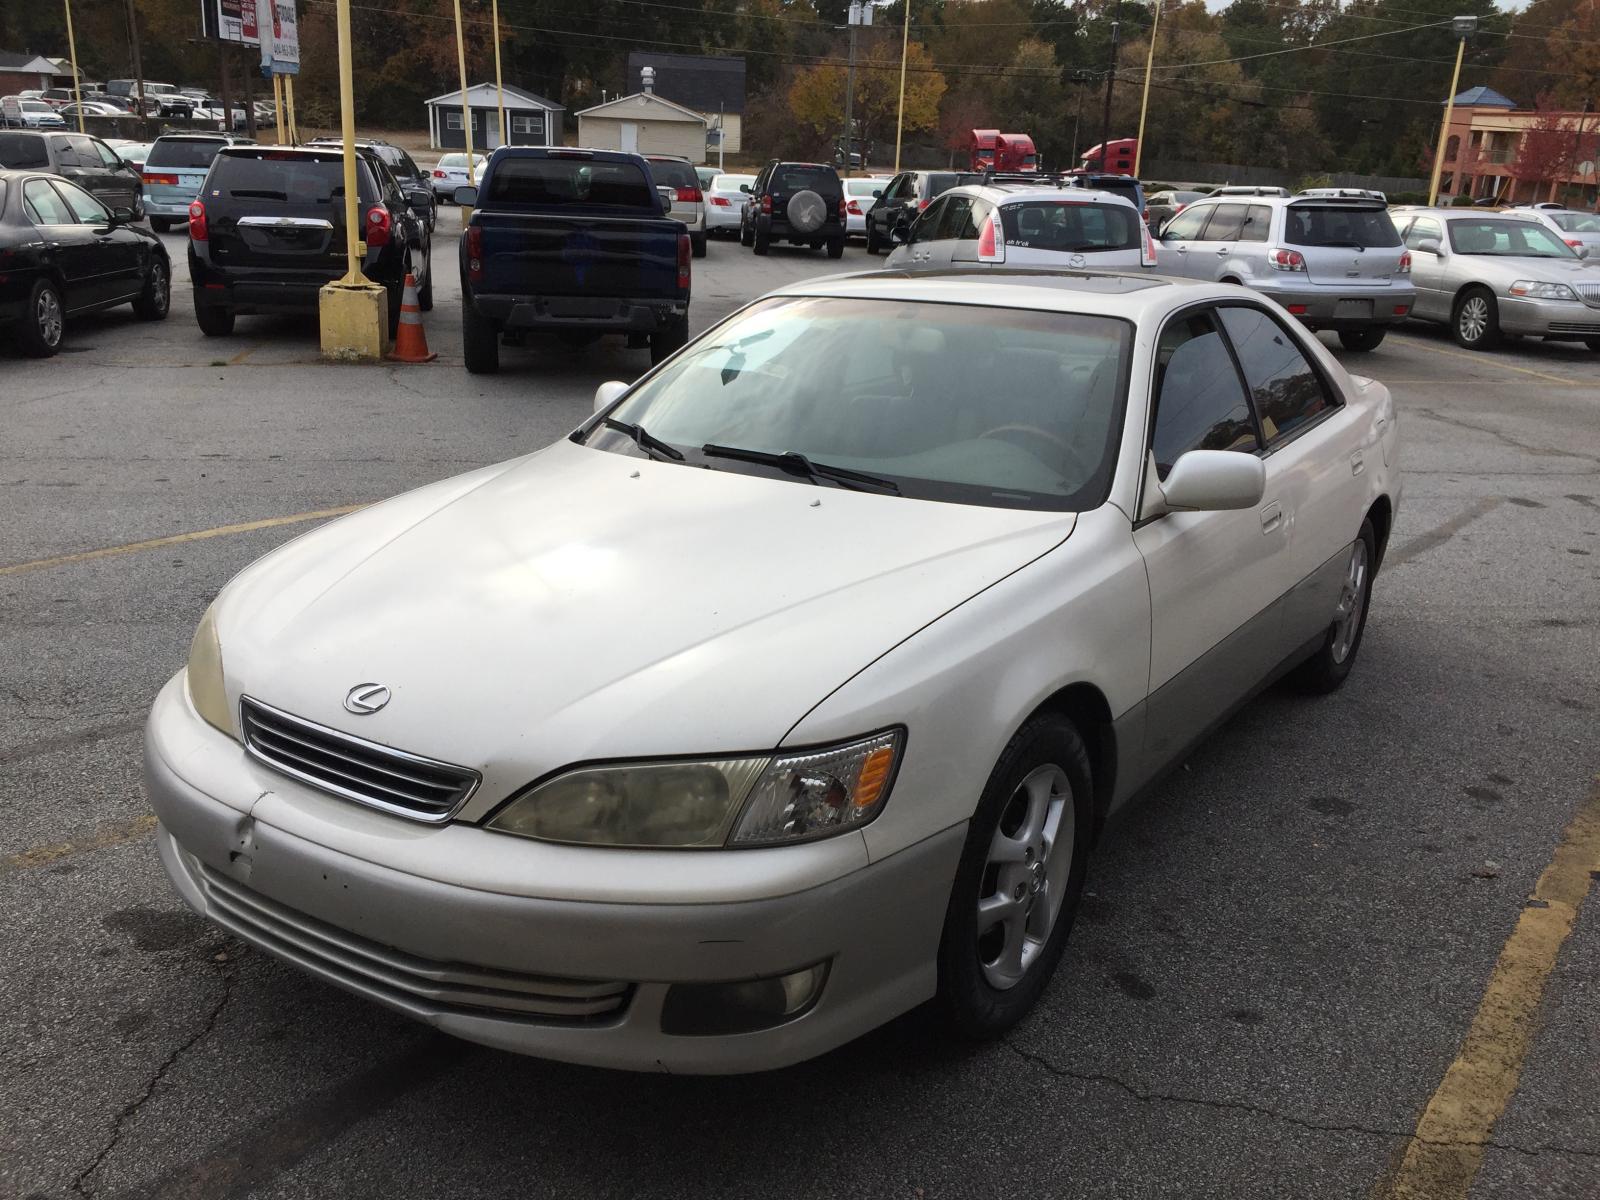
Every dataset has its legends. Real cars people asked us to inspect — photographed, scored, and never forgotten.

Every brand we've inspected: Acura · Audi · BMW · Buick · Cadillac · Chevrolet · Chrysler · Dodge · Ford · Genesis · GMC · Honda · Hyundai · Infiniti · Jaguar · Jeep · Kia · Land Rover · Lexus · Lincoln · Mazda · Mercedes · Nissan · Porsche · RAM · Subaru · Tesla · Toyota · Volkswagen · Volvo — each profile lists the models we've checked.
Based on 5,569 inspections · 63 models · updated Oct 2, 2026
